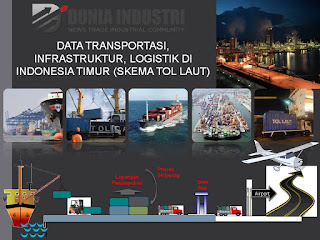
Transportation Data in East Indonesia 2015-2017
Transportation, Infrastructure and Logistics Data in East Indonesia (Sea Toll Scheme) was released late September 2017 showing data, tables and infographics
related to the development of transportation, infrastructure and
logistics with the focus of sea toll schemes period 2015-2017. Presented
in tables and interesting infographics, this data is expected to be
useful for industry actors and related stakeholders.
The Transportation, Infrastructure and Logistics data in East Indonesia (Sea Toll Scheme) begins with the display of Indonesia’s macro-economic data, economic data and outlook, global trade trends, and projected economic sectors in Indonesia by 2018. (pages 2 to 5) Not to be missed, the economic trends show per region (island) in Indonesia along with the trend of income and expenditure of the island (2016) and 2017 target. (Pages 6 to 10)
Going into detailed discussion, data on the implementation of sea toll concept, marine toll elements, 2017 toll road network, sea toll road scheme in eastern Indonesia, comparison of sea toll transportation costs, and priority ports. Let’s look at one by one, the concept of a sea toll similar to motorways of the sea which is a concept in EU transport policy, with an emphasis on the importance of sea transportation. (page 11)
Some of the main points on which sea toll elements are spelled out on page 12. Subsequently, the route network of sea freight (budget tolls) for fiscal year 2017 on page 13. Also described 13 sea toll routes (42 seaports), complete with distance (nautical mill), round voyage voyages, and their frequency. The data is reinforced by the shipping scheme to eastern Indonesia on pages 14 & 15.
Comparative cost of domestic marine transportation and logistics between private parties and sea toll schemes is presented on page 16, so it can be an accurate reference. The integration scheme between sea tolls and air distribution is one of the alternatives in eastern Indonesia, as shown on page 17. On page 18, 10 tables of regional priority ports are complete with operational schedules and supporting infrastructure.
On pages 19 to 23 show infographics related to road infrastructure support to port access in each region, and sea toll shipping schemes in Indonesia. The data is reinforced with the current port condition, where there are 2,392 ports throughout Indonesia. (page 24)
On page 25 & 26 there is a budget allocation for infrastructure development in Indonesia in 2016 with a total of Rp 959 trillion. Then, other related infrastructure data such as roads, airports, railways, coastal shipping, Trans Sumatera toll roads, and urban railway development are reviewed on pages 25 to 42.
The 43-page data of Transportation, Infrastructure and Logistics in East Indonesia (Sea Toll Scheme) comes from a data compilation of Duniaindustri.com supported by data from the Ministry of Transportation, Bappenas, Directorate General of Highways Ministry of Public Works and Public Housing (PUPR), Ministry of Finance and CPM. Industrial database index is the latest feature in duniaindustri.com which displays dozens of data options as per the needs of users. All data is presented in pdf format so that it is easy to download after users perform process according to procedure, ie click purchase (purchase), click checkout, and fill form. Duniaindustri.com prioritizes the validity and validity of the data sources presented.(*)
Source: click here
* Need specific research in Indonesia, there are 144 database, click here
** Need competitor intelligence in Indonesia, click here
*** Need copywriter specialist, click here
**** Need content provider, click here


Komentar
Posting Komentar